MYTABOLITES
– a program by Daryl Lafferty, Arizona State University –
(original concept: E. Mietzsch, H.T. Lumbsch & J.A. Elix)
IMPORTANT UPDATE !!!
Upgrade to the newest version (1.2.2.0). When you try updating updating the database using previous versions the update will fail even though it may look like it has work, but you will no longer able to browse the lichen data.
2016 – February 20 – major update: newest version is now 1.2.2.0 (using a new version of the Symbiota API for updating), see below.
2025 – February 19 – minor update: newest version is now 1.1.2.3.
2025 – September 30 – major update: newest version is now 1.2.0.3
Mytabolites is a program written by Daryl Lafferty in collaboration with Frank Bungartz (Arizona State University), John A. Elix (Australian National University) and Felix Schumm (Wangen) to help with interpretation of thin-layer chromatography plates for the analysis of lichen secondary metabolites.
Chromatography data included with Mytabolites are based on the most recent edition of the Catalogue of Standardized Chromatographic Data and Biosynthetic Relationships for Lichen Substances (regularly updated by the author and in the Consortium), published and distributed by the author, J.A. Elix.
The Chromatograms accessible through the program were originally published by F. Schumm & J.A. Elix in their Atlas of Images of Thin Layer Chromatograms of Lichen Substances (published by Books on Demand, 2015) and the supplement (Books on Demand, 2016).
Mytabolites also allows you to browse which secondary metabolites have been reported from different lichen species (if that information is available in the Consortium).
The program is a newer, much more versatile version of its predecessor WinTab (previously distributed here), a replacement for the program Wintabolites originally published by E. Mietzsch, H.T. Lumbsch & J.A. Elix. The original 16bit Wintabolites no longer runs on modern 32bit or 64bit computer systems.
Mytabolites only runs on Windows, not Linux or MacOS. A platform-independent alternative using NaviKey for the identification of secondary lichen metabolites is provided as LIAS metabolites from the Botanische Staatssammlung München.
NEW: Only with some workarounds, it is possible to install Mytabolites on Linux or MacOS. We have tested these workflows. On linux the program runs without any issues, on MacOS it is less responsive (slower, but usable).
All TLC data and the chromatograms for the secondary metabolites can also be accessed through the Consortium Glossary.
To install Mytabolites …
Create a folder on your system drive and unzip the files included in the following Zip Archive, then double-click the file Mytabolites.exe. If you regularly use the program create a shortcut to execute this file.
IMPORTANT: This File is a Zip Archive that includes an executable file (Mytabolites.exe). For security reasons many institutions do not permit downloading or running executable files.
Windows 10 and Windows 11 typically display a warning message that downloading or executing the program is not recommended. You can safely ignore these messages. The files provided are perfectly safe (as any virus scanner will confirm):
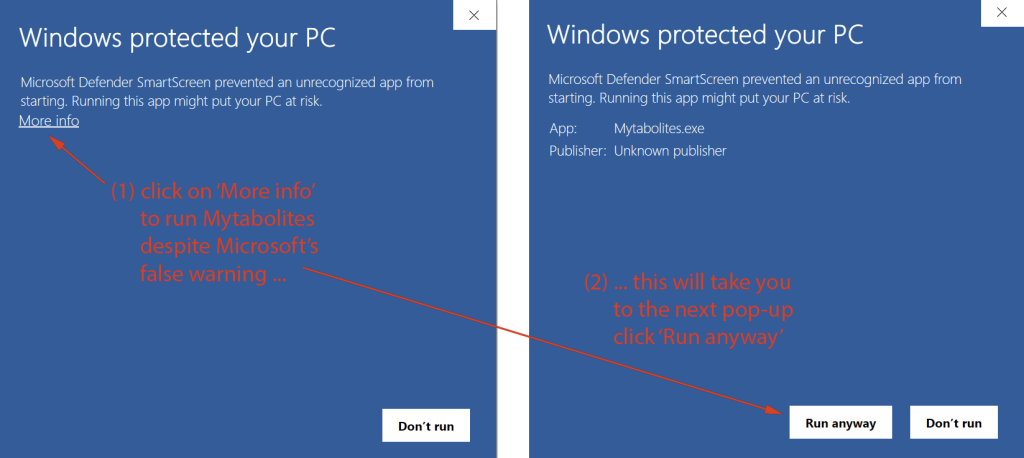
If ignoring these warnings does not work, you may need permission from your institution to install/run the program. Please reach out to us in case you are experiencing any problem (see Feedback below).
Download Mytabolites (version 1.2.2.0) …
This Zip Archive includes the following files:
- Mytabolites.exe (the executable program file; run the program via double-click or create a shortcut to the file)
- Mytabolites.db [a database file, necessary for the program to access the chromatography data (can be updated from the Consortium of Lichen Herbaria via Substances > Update Substance Data)]
- sqlite3.dll (the SQLite driver necessary for the program to access the database)
- Default.cfg (the default search configuration; do not modify this file)
- CurrentSearch.cfg (the custom search configuration according to the most recent search parameters specified)
- The first time when the lichen and substance data is being updated from the Consortium, a text file named UpdateDates.txt will also be saved to the program directory; per default any files saved using the program will also be saved to that same program folder.
Changes in version 1.2.0.3: the program now also runs without an internet connection or without a connection to the Symbiota server. If your computer is not connected to the internet or when the Symbiota server hosting the Lichen Consortium is down, the following message will allow you to run the program offline:
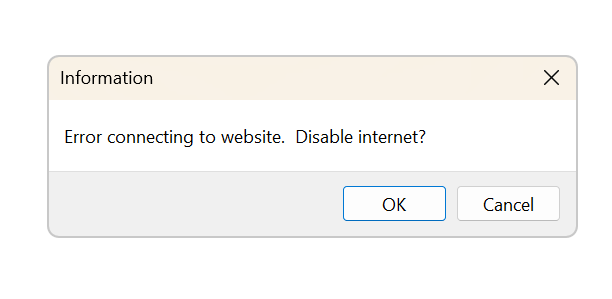
Without an active connection to the Symbiota Server, updates are not possible and images of lichens or chromatograms cannot be accessed, but everything else still works.
Update Check
When you first run the program, Mytabolites will check if a newer version is available and, if available, prompt you to install that newest version. You can also manually check for updates (and update instructions) via ‘Help > Help > Program Update’.
IMPORTANT: With the launch of Symbiota 3.1 Mytabolites now uses Symbiota’s built-in Application Programming Interface (API) to retrieve data from the server. Mytabolites 1.1.2.0 is more stable and updating routines run faster. There are also few minor bug fixes and functionality improvements. The newest version 1.1.2.3 is a minor update that now also includes a backup check, i.e., it checks if the database update has successfully been completed and, if not, restores the previous database version.
Mytabolites includes a database with both Chromatography Data (from the Elix Catalogue, i.e., detailed information on RF values, substance classes, biosynthetically related compounds, colors on the TLC plate before and after charring, spot test reactions, etc.), and Lichen Data (i.e., which lichens contain particular secondary metabolites according to the Consortium of Lichen Herbaria).
Note: when not connected to the Symbiota Server TLC chromatograms and lichen images are not available and updates do not work.
Updating the Program:
Both datasets are regularly updated and emended. For example, we recently started to add substance data for taxa to the Consortium database from Culberson’s “Chemical and Botanical Guide to Lichen Products” (Culberson 1969, 1970; Culberson et al. 1977). Mytabolites uses a local standalone database so that the program can be used without being connected to the internet. This database can be updated from the Consortium and the user is notified, whenever additional entries are available for updating.
IMPORTANT: If you are still using 1.0.5.1. you must upgrade before running any database updates!
In version 1.0.5.1. the program will return an error interrupting the update. You will then end up using an incomplete set of data. Version 1.1.2.0 was released to fix this. All subsequent versions use the Symbiota API for updating and a fail safe updating routine, which first downloads the data, then checks for data integrity and only then updates the internal Mytabolites database.
The Chromatography Data included with Mytabolites can be updated from the Consortium via ‘Substances > Update Substance Data‘ (please note: if you manually changed any entries for particular substances using the edit button, these changes will be overwritten, when you update the data with the data from the Consortium).
The information which lichens contain which particular substances (i.e., the Lichen Data) can be updated from the Consortium via ‘Lichens > Update Lichen Data’.
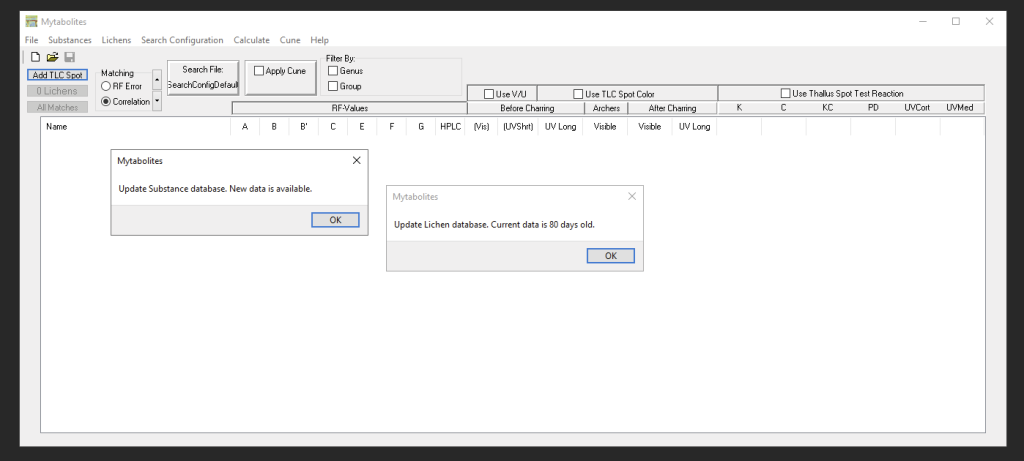
Each time Mytabolites starts, the program checks if the Chromatography Data are up-to-date. If not, you will be promoted to update. If the Lichen Data are older than 80 days, you will be prompted to consider updating that information as well:
For detailed information on how to use the program refer to the built-in Help archive via ‘Help >Help’.
Overview of the Main Functionality:
Main Window & Matching Algorithms (Search Configuration)
The main program window allows you to enter TLC spot test data from plates run in different solvents via ‘Add TLC Spot’. Immediately upon entering data, for each spot a list of possible matches of secondary metabolites is returned. Spots are automatically numbered, named ‘Spot 1’, ‘Spot 2’, etc.To modify data entered double-click the name of the spot. By modifying the data the list of possible matches automatically updates. The list of possible matches being returned is shorter the more detailed information is entered (different RF values from different solvents, color reactions before and after charring, thallus spot tests, etc.):
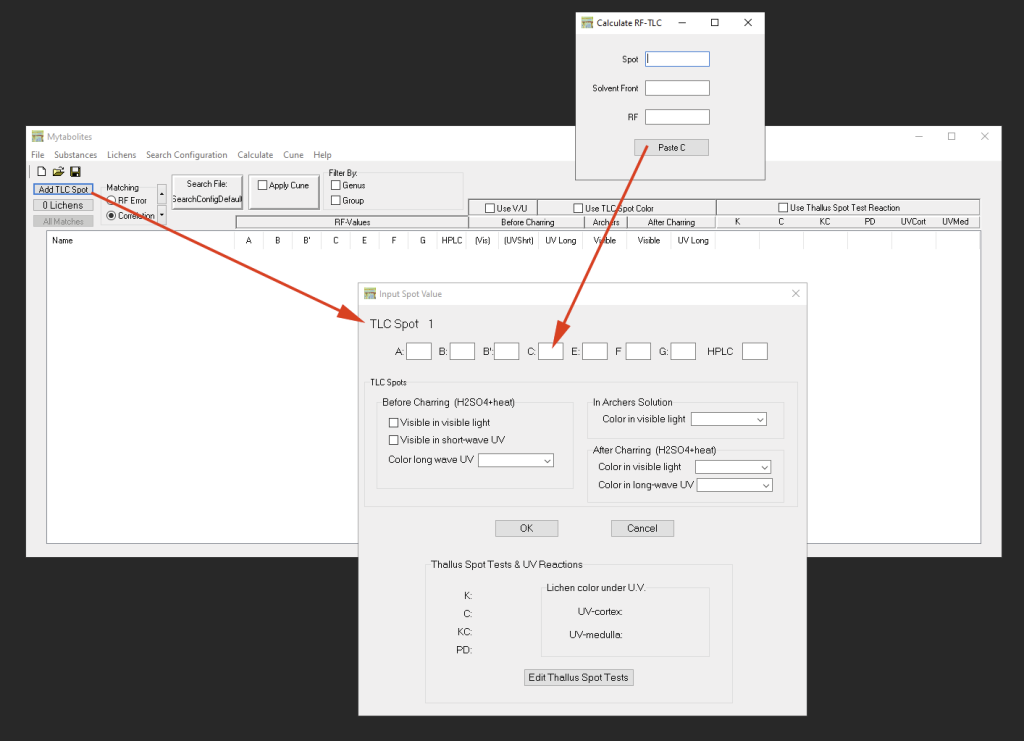
Generally, the results of possible matches depend on the RF values of the TLC spots that have been entered. The accuracy of these matches can further be improved, if the colors ‘Before Charring’ and ‘After Charring’, both in visible or UV-light are taken into account. If plates were treated with Archer’s Solution, that color can also be used for matching results. The resulting list of possible matches can further be narrowed down by entering thallus spot test and thallus UV reactions.
Since color perception (both for the TLC spots and the thallus spot test/UV reactions) can be subjective, it is possible to globally turn off matching results against the colors entered for the spot tests.
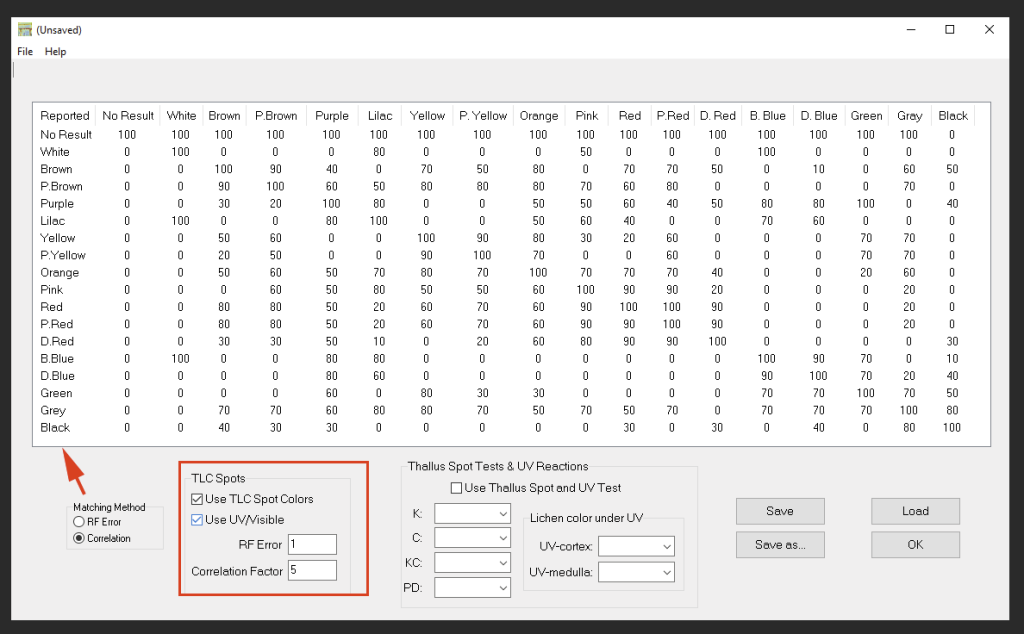
When color matching is enabled, two different matching algorithms are provided (the criteria can be changed via ‘Search Configuration’):
- RF Error is the classic matching algorithm originally employed by Wintabolites. This algorithm simply compares the color of the TLC spots against possible matches included in the database. Since color perception is subjective the matching matrix tolerates a certain amount of variation. For example, the color ‘lilac’ is also interpreted as ‘white’, ‘purple’ , ‘pink’, ‘bright blue’, and ‘dark blue’. Setting the search to ‘RF Error’ compares the spot colors and fails the match if a single value is off by more than the RF Error value. The RF Error value is an integer, typically set to 1 or 2.
- Correlation is a employs a more ‘fuzzy’ matching algorithm. In ‘Search Configuration’ the amount of tolerance how strongly colors may deviate can be modified via double-click. The Correlation Factor determines how many matches are still tolerated. Higher numbers allow more matches. A correlation factor of 5 generally seems to work well. Increasing the number will mean that more matches will be found, but they will be sorted with the best matches at the top.
- In ‘Search Configuration’ it is also possible to configure whether thallus spot tests and thallus UV reactions should be taken into account when matching the data.
- Individual Search Configurations can be named via ‘Save As’ and once different configurations have been saved, these can be loaded from these files.
Saving Search Results
From the Main Window, the current list of TLC Spot data entered can be saved as individual data files and later revised again. Thus, it is possible to first enter the RF values for TLC Spots for one solvent, then save the file via ‘Save As’ to run the next plate with a different solvent. When updating TLC Spot data in a file, the list of possible matches will update automatically, but the newly added data needs to be saved again via ‘Save’.
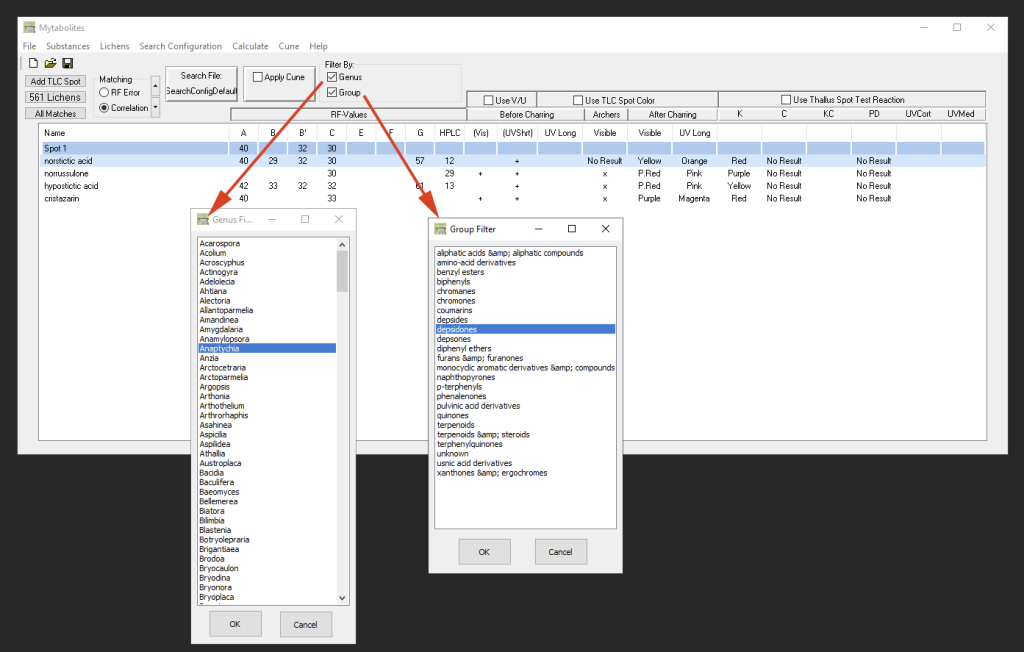
Filtering Search Results
The list of results can be filtered either by genus (from which secondary metabolites have been reported according to the data available in the Consortium) or the list can be narrowed down to the Group of substance classes that the TLC spots most likely may belong to. These filters can also be combined.
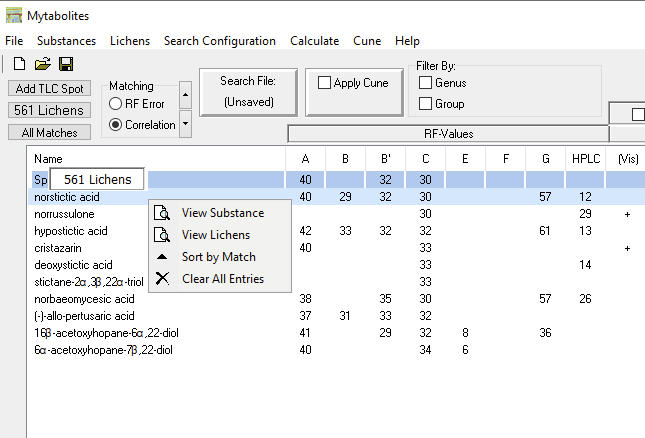
Examining the List
Individual substances in the list can be selected and via right-click the complete chromatography data can be browsed (view substance), a list can be displayed of the lichen species from which that particular secondary metabolite has been reported (view lichens; the number of species is also displayed by hovering over the substance name), the list can be sorted (sort by match), or all spot test data entered can be cleared (clear all entries):
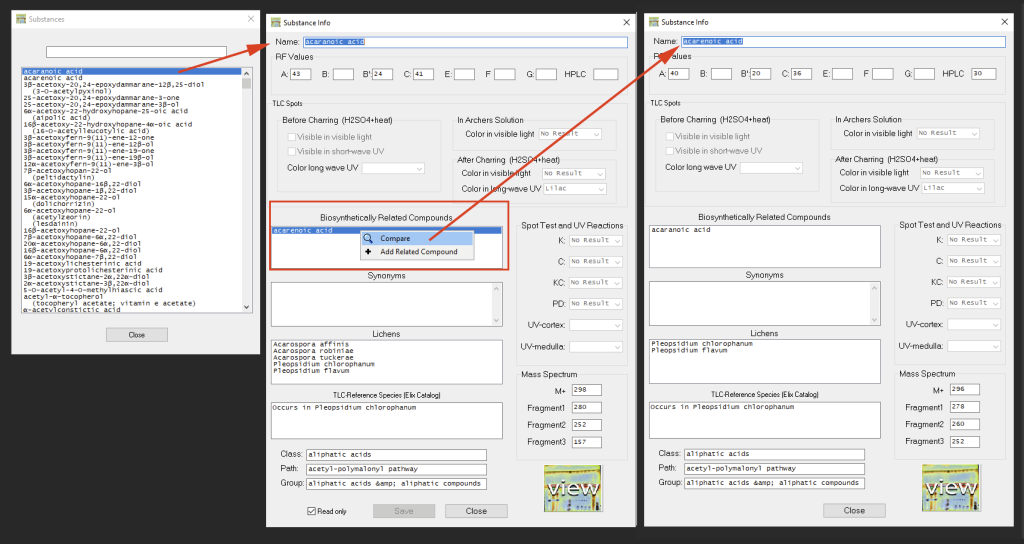
Via ‘Substances > View/Edit Substances’ detailed information about the secondary metabolites can be accessed and compared (even without entering TLC Spots into the main window). Via right-click the data of biosynthetically related compounds can be compared side-by-side:
If a chromatogram for a particular substance is available, the view button can be used to display that chromatogram (only works when the program has access to the internet):
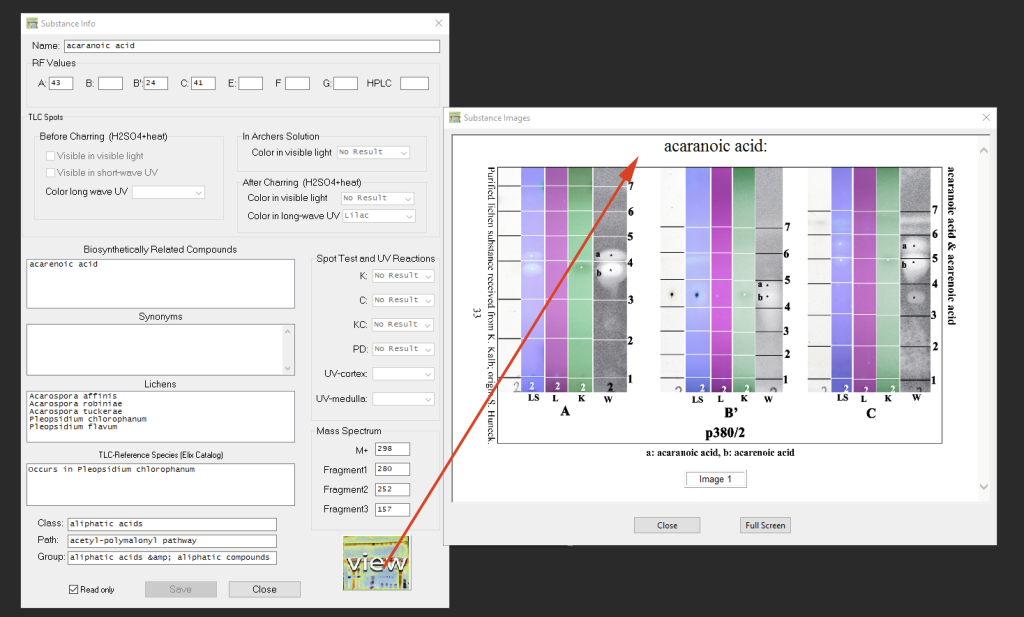
Browsing Substance Data:
For each substance a TLC Reference Species listed in the Elix Catalogue is included, but the program also provides a list of species from which this substance has been reported according to the Consortium. Via double-click the information available for that species can be accessed (images are only displayed, if a connection to the internet exists and if images for that species are available; the button ‘Lichen Consortium’ opens the taxon profile page in the default browser):
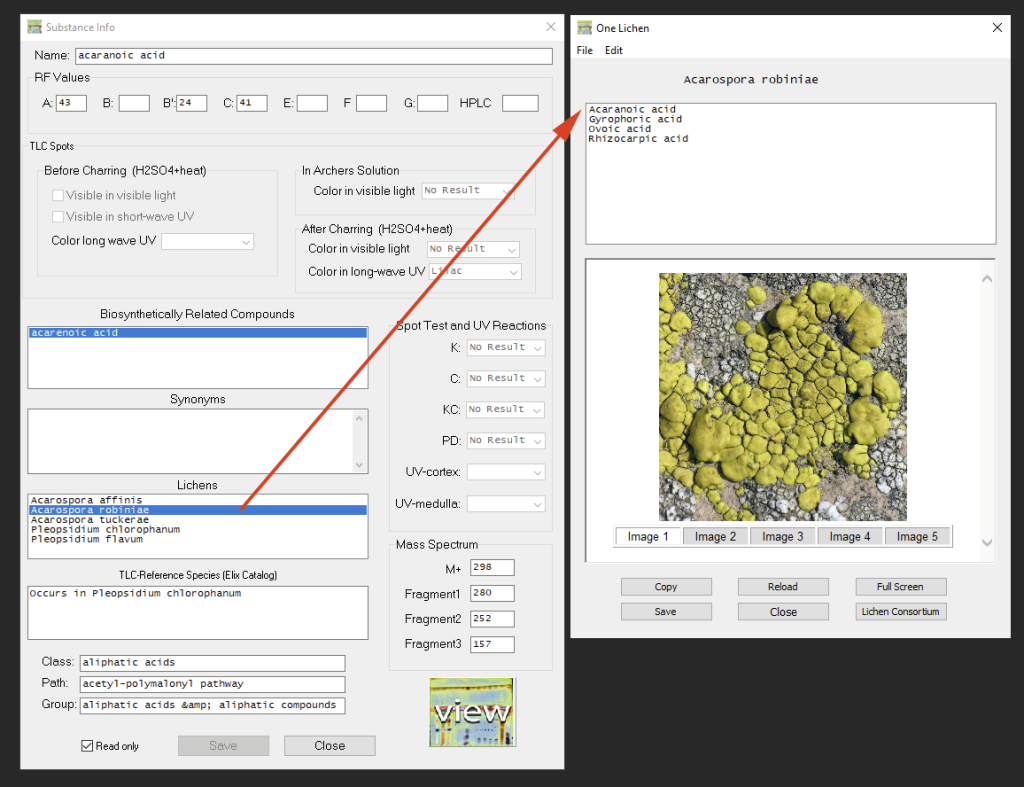
Substance data cannot be edited unless ‘read-only’ mode is checked off (Attention: when updating data from the Consortium any manual changes will be overwritten; to account for variation in RF values depending on different experimental setup it is recommended to “cune” the data instead, see below).
Browsing Lichen Data:
The list of lichens from which secondary metabolites have been reported according to the Consortium can also be accessed directly via ‘Lichens – View Lichens’, either by double-click on a name in the list, or typing into the search box to narrow down that list. In the window that includes the substances reported for a particular lichen detailed substance data can be accessed via double-click.
Images of the species are only displayed, if a connection to the internet exists and if an image of that species is available. If available, up to five images can be compared. The button ‘Lichen Consortium’ opens the taxon profile page in the default browser):
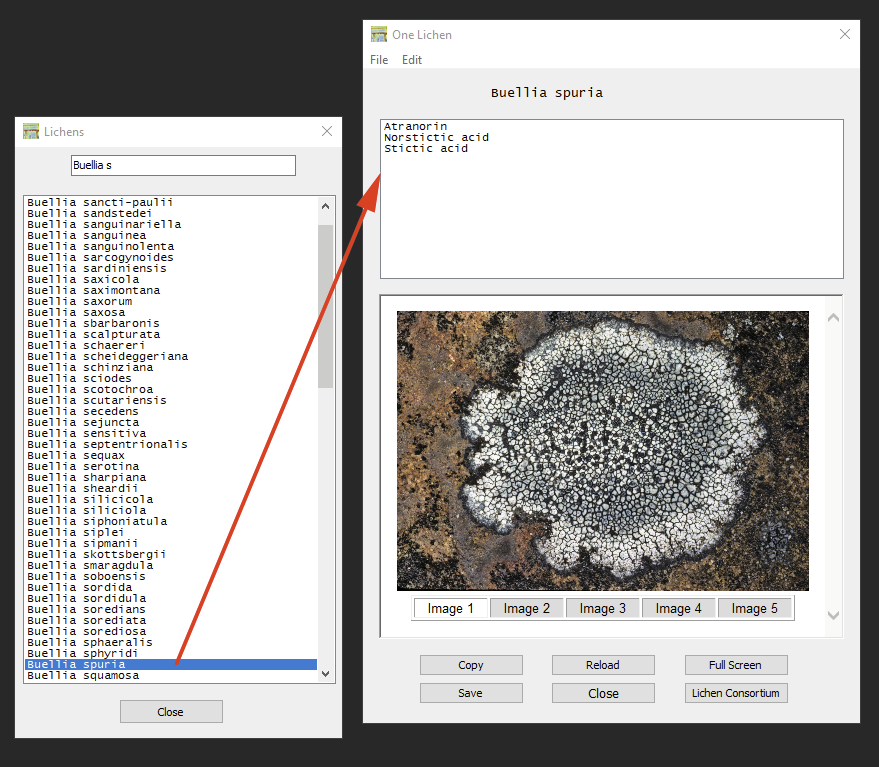
Using the ‘Copy’ button the list of secondary metabolites reported from a species can be copied to the clipboard (names of substances are separated by comma). The ‘Save’ button will create a text file of that list.
Calculating RF Values:
From the main window ‘calculate’ will access the RF calculator, where values can be entered to calculate RF values by entering the distance of the center or a TLC spot from the starting line vs. the solvent front. When RF values for a TLC spot are entered this calculator is also available by double-clicking into the field for the solvents listed in the data entry window.
Improving Accuracy & ‘Cuning’ the Data:
Depending on experimental set up, it is well known that chromatography data may vary. Color perception, the UV-lamp being used, the amount of time and the temperature that plates have been exposed to when charring all cause some variation in how results might be interpreted. Modifying the ‘Search Configuration’ comparing the results with different matching algorithms (RF Error, Correlation) may help to interpret the data. Running plates in different solvents will also improve accuracy of the results. Consulting the database of lichens from which specific secondary metabolites have been reported is useful, but the data obtained from the online database in the Consortium is far from complete.
Even taking all these aspects into account, interpreting the results may remain difficult – especially if experimental variation may cause significant variation in RF values. Values reported in the Elix Catalogue are based on standardized TLC, using regular 20 x 20 cm TLC plates in conventional upright glass-tanks. The chromatograms published in the Atlas by Schumm & Elix (2015, 2016) are based on a system using 5 x 5 cm TLC plates. At ASU, we use 10 x 10 cm plates in High Performance TLC (HTLC) tanks.
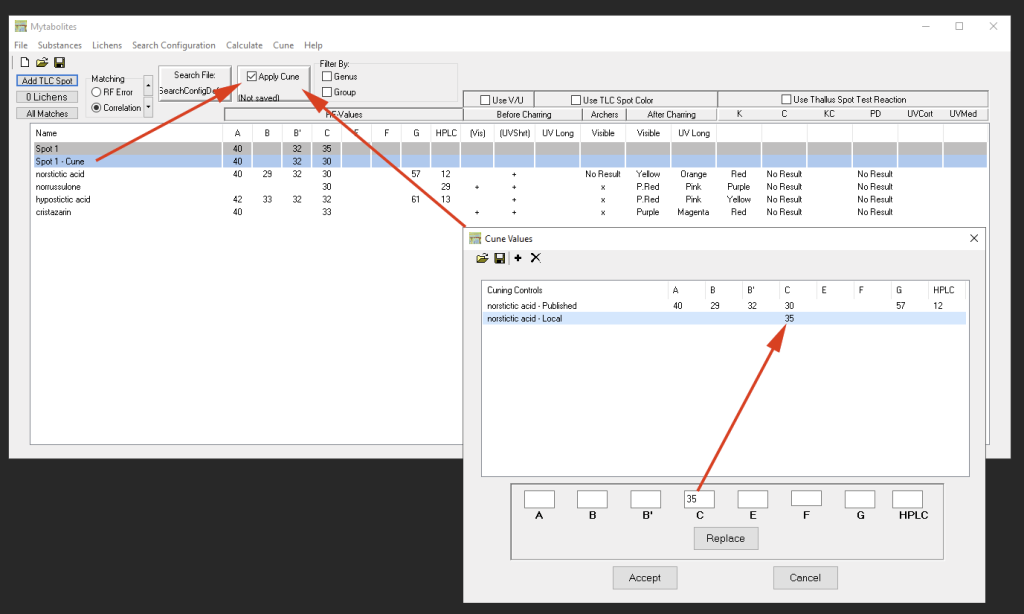
Using such different experimental setups, it is particularly important to use controls of known secondary metabolites to calibrate RF values. Generally recommended are common substances like Atranorin or Norstictic Acid, but any known substance can theoretically be used. Wintabolites introduced the concept of ‘cuning’ the data (the term was coined after Bruce McCune from Oregon State University, who first suggested this type of RF value calibration).
Via ‘Cune’ a list of known substances can be added (using the ‘+’ button). The published values as listed in the Elix Catalogue can then be modified for the actual values measured/observed in the different solvent system. If “Apply Cune” is enabled in the main window the list returned in the main window will update taking the deviating RF values of the controls into account:
Citation:
For publications, we suggest to cite this program/website as follow:
Lafferty, D., Bungartz, F., Elix, J.A. & Schumm, F. (2024) Mytabolites – a program developed at Arizona State University for the interpretation thin-layer chromatography plates, for the analysis of secondary metabolites from lichens, based on an original concept published by E. Mietzsch, H.T. Lumbsch & J.A. Elix. Help & Resources for the Consortium of Lichen Herbaria, available at https://help.lichenportal.org/index.php/en/resources/metabolites/
You may also want to cite the primary resources (the Chomatography Catalogue by J.A. Elix and the Chromatogram Atlas by F. Schumm & J.A.Elix) as follows:
Elix, J.A. (2022) Catalogue of Standardized Chromatographic Data and Biosynthetic Relationships for Lichen Substances. Sixth Edition. Published by the author, Canberra.
Schumm, F. & Elix, J.A. (2015) Atlas of Images of Thin Layer Chromatograms of Lichen Substances. Books on Demand, Norderstedt.
Schumm, F. & Elix, J.A. (2016) Atlas of Images of Thin Layer Chromatograms of Lichen Substances. Supplement. Books on Demand, Norderstedt.
Culberson, C.F. (1969) Chemical and Botanical Guide to Lichen Products. University of North Carolina Press, Chapel Hill.
Culberson, C.F. (1970) Supplement to “Chemical and Botanical Guide to Lichen Products”. The Bryologist 73: 177-377.
Culberson, C.F., Culberson, W.L., Johnson, A. (1977) Second Supplement to “Chemical and Botanical Guide to Lichen Products”. American Bryological and Lichenologial Society, Missouri Botanical Garden, St. Louis. 400 pp.
Feedback:
We welcome bug reports and suggestions: LichenConsortium@gmail.com
